YouTube Video
YouTube Video Transcript
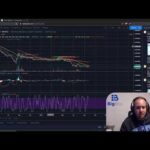
[Music] hey this is David for big bits and in this video we’re gonna get started with our series on pine script editing and developing for tradingview to plot out whatever we want an indicator a strategy a combination of indicators whatever we want we’re gonna be able to plot it out on tradingview if you’ve seen all kinds of crazy scripts on tradingview or you have ideas for strategy it’s gonna show you how we can learn to do that all on our own now I am also going to provide you with the source code on all the scripts it’s gonna be available on tradingview I’ll show you that at the end of the video if you’re curious you can go look at my profile big bits IO on tradingview but what we’re gonna do today is we’re going to go through the process of creating a new indicator and then I’m gonna show you all of the key components of the script and show you kind of what they mean and what they are doing for the script that we’re working on so the first thing you’re going to want to do maybe you’re gonna create a new script I’m gonna assume since you’re watching this video first you probably haven’t done a script before or maybe you have and maybe you just forgot out too so first we need to go to the pine editor this is where you can work with your pine script let’s open that up I’ve already got my indicator up that we’re gonna work with but you’ll want to choose new and it comes with some templates but I use a blank indicator script and I wrote all of this and I have kind of come up with a little bit of a style guide for the development of the tutorial scripts I’m coming up with you’ll notice I forced the pine script version this is just a little bit of code that tells the pine script processor in the backend or under your cpu however they do it it tells it that it has to use the fourth version of pine script and it has slight different syntax and that just means you have to write things a certain way with pine script for it to work with version 4 and I also added a section about the author the version of pine script and you can also find my published scripts here if you’re viewing this from trading view and you just happen to come across this you’ll be able to find this by using that URL and then I also added a URL to the documentation for everything we’re gonna be working with so let’s go ahead and get started we’ll go through all of this I’m gonna kind of show you and tell you exactly what this is this is just a simple moving average and as you can see we’re using a twenty-one period moving average on the daily chart on Bitcoin so the Purple Line is a twenty-one period moving average for Bitcoin over about the last year now it’s very simple but there’s a lot of things we have to know so the first thing we do when we’re creating our own indicators we have to provide a line that’s calling function called study and this pretty much just tells pon script that we’re going to be creating an indicator and it accepts a few different parameters and parameters are just essentially options for this particular function to tell it more information you can see when you hover over it can give you some more information or if you go to the URL that I have here in the code comments it’ll take you to the actual user manual for pen script version 4 and it’ll tell you what everything in there means I’m not gonna go over all of the reference documentation but I’ll show you what some of this stuff means so the short title is what’s going to show up on the chart it needs to be short so you don’t overwhelm the screen with all kinds of information now the title itself is simple moving average it’s a very simple title to use it doesn’t really mean too much to me here if you are going to be publishing your own scripts ever make sure that you have the title set correctly here because this is what will show up in the Public Library okay so once we’ve done that there is one other option that is the overlay option now when you choose overlay of true it’s going to plot anything that you wanted onto the chart it’s going to overlay it on the existing chart if you have it set to false it’ll create a new plot area below this and to show you this will add the built in MACD and you’ll see that this will pull up another plot area then you can see that information on a different chart below the actual price chart so I’ve removed that now that we’ve told it to what our indicator or our study is going to be called and given it some information about itself now we need to know information about the indicator itself well we know we want to create a simple moving average so what do we need to create a simple moving average well we need the period for the simple moving average so this line is calculated by looking back at all of the data within the period and by default it’s gonna be 21 so we’re gonna look back 21 candles and average those out and it’s going to plot that particular point on the line now since the price changes you can see the line going up and down that’s why they call it a moving average now the reason it’s important to use this input function is because that is what the study or the indicator uses for you to configure the study on the chart so we have one input and that is for the moving average period by default I have it set to 21 let’s change it to 200 hey I changed the scene you think about that change that back okay so oh boy I’m a few issues here I’m testing my new recording software so there’s some hotkeys I think are overlapping with what I’m doing here let’s change those around anyway we’ve changed our input or moving average period to 200 and you can see now the line is a 200 period moving average and it acted sort of as resistance here and here and it never really got back up to it here during the bear market and perhaps it’ll form some sort of support on the way back up for Bitcoin over time now you’ve seen how we can edit the information being used for our simple moving average but we haven’t calculated the simple moving average yet but before we do that I just wanted to point out the reference information is on here for the input as well so you can go and you can look at the user manual to see what’s going on with the input and the different things that you can do with that minimum values maximum values things like that you can do all sorts of things a lot of times the options aren’t required so if you’re looking at other people’s scripts or my scripts you won’t see all of the options in there so it’s a good idea to look at the resources to see what other options are available as well now the moving average value itself the value that’s being plotted and is shown on this purple line that is calculated using a built in function called simple moving average or the SMA the SMA is calculated by looking at the close of every candle looking back the period that we set with our input so it’s right now it’s looking back 200 periods calculating the average close of all those candles and plotting that information on the purple line so as with the other items I have added the built-in function for the simple moving average here if you’re not aware of simple moving average it’s just a straight normal average what you learn and I guess fourth or fifth grade maybe sixth grade pre-algebra where you take a bunch of numbers add them together and divide them by the number of entries in the list that you were working with it’s just a straight up average and there are very very many different moving averages that have come up and you can have access to all of those through tradingview but we’re just going to use a simple moving average now and once we calculate that we’ll be able to plot it so we set our moving average value equal to that of this built-in SMA function using the close and the moving average period and we can finally plot this and the plot of course tells it to plot it on the chart write it draw it however you want to say it it’s putting the line on the chart now and we can tell it what color to use and the line width to use and there are also many other different options for plotting we’re going to get into that a little bit later but you can see you can choose the color you can do all sorts of things with plotting and not even all of its here so we’ll have to get back into that a little bit later but that just draws it on there and we can also set the width you can see it’s a pretty wide line so that kind of does it for this particular script I tried to keep it very simple I hope you can understand where I’m coming from here if you want to go ahead and add it to any chart that you have so that you can look at the source code you can go to the public library and you can search for scripting tutorial one simple moving average you can see I’ve already got it started on quite a few others already and you’re more than welcome to go ahead and look at those once you add it to the chart it’ll use that default twenty one period moving average that we started with and if you want to look at the source code and maybe make a copy of it and start working on your own code just click on those brackets up here and you can see the source code if you want to start working on your own you can choose make a copy it’s pretty pretty easy to work with if you want to go ahead and look at all of my scripts and maybe by the time you’re seeing this video we’re a lot further along in the series maybe we’re even when done with the series you can take a look at my profile on tradingview and go to the scripts section and you can see all of the scripts that i’ve done and while we’re here i can give you an idea of what we’re looking at head to in the future in this series we’re going to next take a look at plotting three different lines and they’re going to be used a different moving average other than a simple moving average then we’re gonna take a look at using more than one type of moving average as an option so we’ll give people an option of what type of moving average they want to use for each of the three lines then we will add on some more moving averages that weren’t included on the tutorial three and we’ll also provide some other options such as the source so we plotted the moving average in this video based on the close of the candle in this particular video we’ll go over how users can choose whether to plot or to calculate their moving averages based on the height of the candle or a median or other types of sources that are available built-in through trading to you and then the fifth video I’ve already gotten pretty much all the source material prepared for and that is a triple moving average crossover so we’re gonna take what we’ve learned here and then we’re going to detect crossovers and plot them on the chart so it’s you can already see there’s a lot to look forward to and if you have any ideas please leave them in a comment below I am very interested to see what people want to know or if there are any scripts out there that you like or already used and you would like to see replicated maybe they’re closed script and we want to see if we can replicate them on our own our closed source excuse me and we want to see if we can replicate them on our own we can try that as well or if you just want to understand what’s happening in an open source script that’s fine as well so thank you for watching the video please leave a like if you liked the video subscribe if you want to see the tutorials that I’m working on they’re gonna be really cool obviously when once you get into talking about crossovers you’re pretty much creating a strategy with an indicator and well it will eventually get into strategies as well but once you can detect the crossovers you might be able to use those as an alert or maybe just an indicator when you look at the chart that hey maybe the bearishness is over with and we’re starting in or a bull market you know you can use that kind of information to help you point out these things so that’s even though you have these lines on the chart it’s really easy to see what’s going on so there’s a lot of good things we can do yeah that’s all see you all soon thanks for watching and make sure to check in on the next video so that you can see how we do the multiple lines thank you [Music]