YouTube Video
YouTube Video Transcript
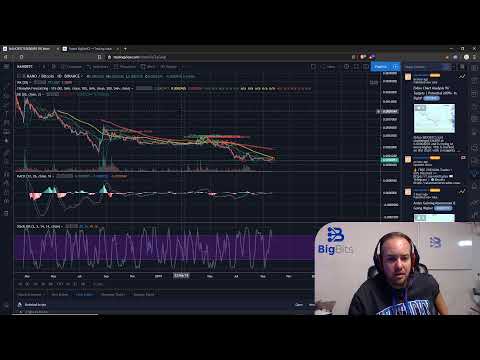
oh well hey everyone yeah I’ve been talking to myself for a minute here because I didn’t quite fully understand YouTube live streaming I’ve done it on Twitch a time or two before just to play around with it but we’re just getting started here so we’re gonna go back and start this whole thing over I went through a couple of coins and stuff but we’ll go back to where we were in fact a Bitcoin USD I think I’ve been looking at this on coin base we’re looking this on a weekly chart right now and for those who don’t know I said in my announcement video that I want to start doing weekly reviews and I think a live stream is probably a good format for it for now we’ll try it out I believe all the data is gonna be archived and everything so we’ll get to see what’s going on and if there’s something wrong with the stream please let me know it’s the first time doing it I think the quality should be good everything’s coming back good on YouTube side of everything so I’ll go get started on talking so looking at the Bitcoin weekly chart honestly we’ve had some tightening range everyone has been watching this and they all keep drawing you know triangles or wedges or penance whatever you want to call it but one of the things I’ve noticed is these are definitely higher lows and these are definitely lower highs and it’s kind of semantics whether or not you think it’s a triangle or whatever but one of the things I do like about trading view right now is that I can switch this to like a five day increment on the candles and it makes things a little bit more clearer you can actually see a slightly different trend here and it’s a little bit more obvious now I didn’t turn out that great but I don’t I think it looks better on the five-day chart than it does on the weekly and that little drawing tool it’s in my way every time okay so the general idea is that price is consolidating right here and I did have to volunteer bands on just to show you on the weekly they’re starting starting to tighten up pretty good the back launch is tomorrow if you don’t know it backed is it’s physically settled Bitcoin trading mostly for institutional people so the reason it’s so exciting is that it is physically settled and that all of the trades are gonna be paid back in Bitcoin instead of people trading for cash like instead of you know buying and selling Bitcoin for cash they’re gonna be trading Bitcoin to get Bitcoin essentially so if they have a winning trade they’ll get a Bitcoin back at least that’s the way I understand it and it’s pretty promising if you’ve ever traded at bit mechs you’ll know that it’s a it’s a really good way to trade and to stay in Bitcoin so even though you’re holding a position you still hold the Bitcoin that you went into the position with and then at the end of the position if you were profitable you get more Bitcoin so it’s really a great trading tool to keep people in Bitcoin so that they don’t want to go back to cash or whatever and it kind of keeps the price up in my opinion that people are holding it anyway back to the Bitcoin chart let’s go back to the daily the weekly you can see it’s gotten really tight so let’s go back to this single day chart and these things have definitely gotten really tight on the Bollinger Bands these are super tight right now I’m trying to see if there was a time where they were tighter this year and they’ve definitely not been maybe if you go back into where we dropped off that cliff from 6k all the way into 3k maybe you can say they were just as tight Ninh but I don’t know they’re really tight up here one of the things I’m looking at and I think a lot of people are looking at is this 200-day moving average if it were to break down that’s kind of my target for looking to get in a little bit more on a position and of course trade your own stuff but if the price jumps down or falls down to the 200-day moving average this is where I would expect it to hold if it is still a bull market you know there’s room for it to go down during the bull market on a last bull market it never went below the 21 week EMA and never closed below the one-week mid Bollinger Band and you can see the mid Bollinger Band it is right on it right now on the weekly chart so if it holds to the last bull market patterns then it’s going to bounce here but you know every cycle can be different every trade can be different so on the daily if it does break down I’m expecting it to be around the 200-day moving average because of course we’re already under the 100 day moving average either way I don’t think it’s too bad it does come down to the 200-day I think it’s going to keep the so chart I over sold quite a bit if it stays down there and goes down to the 200-day average it’s gonna give it plenty of room for some relief and to make a big move back up potentially so that’s where I’m at with Bitcoin right now I’ve had some other ideas that I’ve posted on my trading view account I started posting the ideas on there as well as the scripts if you watch the video earlier where you can see the scripts I started with the very first one here and we just kind of talked about how you would add an indicator a custom-developed indicator to the chart and we’re gonna go through this all of these tutorials and you can see where I’m at now I’m using this one and it actually has forecasted movements on the moving average if the price were to stay flat for the next five periods so it gives you an idea of what the trend would be in that moving average if you took out the last few candles that’s pretty useful stuff and I’ll go over that in other videos on here but for now let’s keep it to the weekly stuff I want to get through this pretty quick so that I can get back to things but XRP this idea I really think this one might be onto something because the MACD is crossing over on the weekly RSI has been down for a very long time and if you look at the chart on the idea historically it’s hardly ever been down that long that low so I like it to potentially bounce back up here but I am wanting to note that there is this potential area of resistance here that I’m looking for it to kind of slow down at at least or probably turn back around if it’s not all season I don’t think it’s all season yet I think ripple might be one of the first to make a huge move if it is alt season so I’m really watching this resistance line pretty closely if it were to burst through this and close then that would be a huge indicator that maybe not only XRP or ripple are going up to higher levels but maybe all coins in general but I’m not entirely convinced and I’ll show you why let’s look at the chart here and I believe that was Polonius yes so this is the daily chart and if you read the idea that I posted on trading you can see that we were testing resistance at the 100 day moving average and I was kind of expecting a retest at the 50-day moving average was it looks like it’s gonna do and in that case it would try and bounce off support and potentially come up to the 200-day moving average and that line of resistance I was talking about which looks like they’re gonna coincidentally be intersecting here and usually when key lines of support or resistance intersect it tends to pull the price to it for some reason I’ve noticed this in the market several times but in most notably on the downtrend in the bull or in the bear market for Bitcoin in 2018 is that key resistance levels or support levels I should say when they intersected it seems like Bitcoin always seemed to make a move toward it so it’s something I’m keeping an eye on it’ll be interesting to see if ripple makes a move up towards point or 4,300 satoshis or so and by the first week or so of October which is not very far away at all at this point so yeah let’s turn this back to the weekly chart all right yeah you can see it’s it’s leaving this area and it’s already quite high on the still charter south which is another reason I think if it does move up maybe it does stall out at that line of resistance that we were talking about all right just have a couple more ideas I wanted to go over before we move on and call this video litecoin and Bitcoin now I looked at this one on the 4-hour chart the other day I thought it looked pretty good this is the weekly chart it’s kind of in the same position as a lot of other alts this stoat RSI has been down for a very long time and you can see there was something kind of similar back here earlier in the year or earlier at back in 2018 I should say where the price just kind of continued to dive down and then it finally after being oversold for very long amount of time wanted to come back up it looks like it’s kind of doing something similar here and I think yeah there’s probably some room here for it to come up quite a bit and it looks like the MACD is wanting to turn back over it’s gonna be kind of hard for it not to because there’s all this downward momentum on the moving averages it’s gonna have to really dump hard to keep the MACD from crossing back over although if you know the MACD indicator the price can stay completely flat or just kind of generally float around this area and it’ll return back to kind of a neutral position at zero so just something to keep an eye on but I do think it it looks like it’s good to turn back up for just a little bit and looking and a little bit closer this is what I was looking at a 4-hour chart you had this kind of wedge let me zoom in even further all the way into the 4-hour chart this is what I was looking at when I made the idea and I was hoping that the 50-day would prove as support or the 50 period would prove as support I don’t look like it’s happening but the prices are still kind of consolidating in this tight range here looks kind of redo all this and you can get an idea okay so I mean if you just redraw it it works but honestly the the momentum on the MACD looks like it’s shifting back towards the potential turn up the CICC astok RSI on the 4-hour is way oversold I still think this is a good spot personally for me to go to think that it’s gonna go up you know I think there’s a lot of great room here on the for our I’m this wouldn’t be something I’d want to be in for a long time because like I said if you go back to the one day chart there I mean it’s kind of moving down here on the stochastic RSI and I would kind of expect it to continue going down there but in the short term or maybe even just this week it can have a bounce back up who knows this one’s a little bit harder for me to read outside of that 4-hour chart right now to see what its gonna do mainly because some of this stuff is pretty neutral and if anything the MACD looks like it might be getting ready to turn down so there’s a lot to keep up with here and kind of see what’s going on all right nano and Bitcoin they know is something I kind of followed for quite a while I loved when I used nano how you were able to transfer things with no fees and it was really cool but as you can see on the idea I noted that we are potentially hitting resistance here on that 50-day moving average and that 50-day moving average also goes back to being support on Nano quite a while back the stoats RSI looks like it’s turning down as well so it definitely looks like it’s gonna continue to play out like that which is unfortunate because if you go back out in the chart nanos pretty much been nothing but down and I’m not really seeing much good for it right now personally it’s it’s a shame and somehow nano despite losing all of this is still market cap number 45 on coin market cap a coin I think it might have been in the top 20 up here I don’t know this was at the peak of the alt mania but it is went nothing but down pretty much ever since then and it’s still in the top 45 I’m absolutely shocked there hasn’t been a better relief for it here in the last week or two when some of the other coins have been getting some pretty decent relief I know stellar I think had a pretty big jump up and some other coins as well it just doesn’t make any sense to me why a top 50 coin doesn’t have any relief but it is what it is I’m not too worried about it I’m not really looking for anything here right now nothing really stands out then I think it might be going down some more but I don’t know I really don’t know all I really noted on this one I just I had a neutral position on this idea and if anything I would lean towards it going back down just because it is testing resistance it’s gonna have to get a boost from just general altcoin DOM and it’s coming back up if it’s gonna make a play towards going higher so the other one that I’m going to cover before the end of this video is the basic attention token and this one as I mentioned when I was talking about nano and what was it ripple or litecoin excuse me like coin it’s coming up to support or coming up to resistance on a 100 day moving average which also happens to coincide with previous support in the past going back quite a ways so I’m kind of expecting it to it’s very least slowed down here and turn back around you can see this is the daily chart still charts I was awfully high so it to me I think it was gonna turn around I don’t even know what it’s at right now I’ve checked it since I made that idea let’s check it over at him yeah so you can see it definitely did turn down from testing the 100 day moving average there where was it yeah it was still green the last candle was still green when I made the idea so that was that one turned out to be pretty good it’s down quite a bit I think I made it around here when – it’s at point one nine that’s what five percent not bad but it could very well of course like the other ones that I’ve mentioned find support at the 50 is probably definitely not old season yet from what I can tell there’s really gonna have to be a major move now in my opinion personally I don’t think it’s all that bad of a time to start averaging in on old coins because the all-time highs are way up here I’m pretty much all the alt coins and the current price way down here now can some of these coins go to zero absolutely do I think the basic attention token which brave uses the browser that I’m using right now do you do I think the token that it is using is gonna go to zero no not at all because there actually is a use case for that token and they use it for their advert advertisements daily people get paid or tipped in basic attention tokens I I am a brave verified publisher myself but I do see the potential for it to continue to go down you know obviously I don’t want it to go down below this level but could it yeah personally I’m looking at averaging in I think I started averaging in a couple of weeks ago for myself on different alt coins and basic attention token has been one of them now I don’t make huge plays in all coins I’ll be honest and I can’t recommend anything for anyone if you look at the video descriptions you’ll know that nothing is no no this is financial financial advice okay I’m just a really good developer who likes to create stuff related to trading and I have a pretty good sense for this stuff but could it come down more absolutely but the risk to reward is getting so good that I’m having a hard time not justifying averaging in on some of these really good alte projects and you’ll notice here and I mean there’s still kind of a divergence going on even though it’s gotten this relief and and maybe it’ll come down some more but the MACD on basic ninja toshin hasn’t been above zero really I mean it’s above zero here in the last couple of days but it hasn’t been significantly above zero since back in the first of May it’s been a long time there’s a lot of potential on the risk/reward in my opinion so that’s why I’m averaging in on some of these things I mean pretty much all all charts look like this in some form now Nano of course that was a bit different that one might have a harder time coming back up you know there’s really not as strong of a use case for nano even though the technology is really cool i I don’t see people using nano every day like basic attention token and I also don’t see ripple really being juiced every day but that doesn’t mean it isn’t okay I think they said it’s meant for banks or something but I don’t see it being used personally I see in theory ‘im I see my session token’ I see all kinds of different coins being used that have held up a little bit better in the long run compared to some of these other all coins like nano mostly the ones that I would be looking to average into personally are probably top 30 because I think if adults season does occur most of the money that is in Bitcoin will roll into those higher cap alts and then once people have made enough money off their higher cap I’ll still probably move them into the low cap bolts once they have finally been beaten down comparatively to the rest of the market that’s just kind of where I’m thinking this is going because you can already see it that some of the the higher cap alts are holding up a lot better versus Bitcoin then the lower caps and you’ll notice in the last bull run or the last all coin mania all season whatever you want to call it that’s kind of how it happened the alt coins that were higher market cap we’re the first to move up and actually let me pull up coin market cap and I can I actually kind of show you this so where is the dominance tool area let’s go back and you can see these huge moves and Bitcoin dominus down that looks like it was mostly Ripple they’re causing that let’s take out some of these other ones some of these other smaller ones here and the others okay do you see there was a huge move in Bitcoin dominance it was mostly Ripple a huge chunk in aetherium then it shuffled back into ripple but it was all coming out of Bitcoin it was mostly going between these two coins all the way down on that on that dominance thing but you’ll notice coin dominance kind of stayed low I mean it had a had a good jump here but what do you think happened at this point in time from when ripple was so high or aetherium excuse me I got a mixed up what do you think atheria m– was so high in Bitcoin was so low and they actually kind of went sideways or a Bitcoin kind of went sideways and aetherium kind of bled out that money didn’t all go back into Bitcoin obviously it didn’t shoot straight back up a lot of that money I think went back into the lower cap coins that aren’t even on this chart the others don’t really see it so much on the chart there’s so many um but that’s just my opinion on what’s gonna happen but you can see that the major players give a huge boost I mean I thank you everyone else is left getting scraps but I think it’s probably gonna take care of it for the video today thanks for sticking tuned to the stream those of you who did I do appreciate you checking in it’s my first time doing that I want to make this a weekly thing and hopefully get some more people involved these indicator scripts are coming along very well I’ll show you I have five setup we’re gonna have five videos already and you can see I’m actually using these and we can see the moving average crossovers we’re printing labels with information about the indicators and then also at the end of the moving averages we’re actually doing forecasting now as well which is pretty cool but anyways I’m gonna in the stream thank you all for checking it out for those of you who actually came by the stream I appreciate it we’re just getting started I know there’s hardly any viewers during the live stream but we’ll be good that’s grown it’s just started thank you