YouTube Video
YouTube Video Transcript
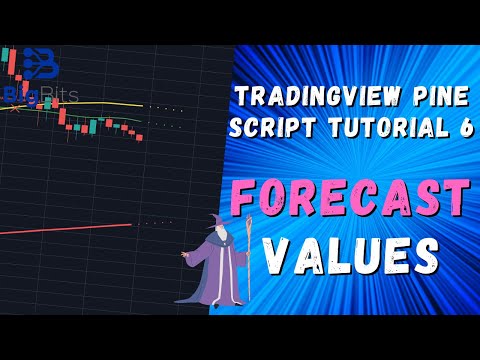
[Music] hey this is David for big Benson in this video we’re gonna talk about our sixth scripting tutorial and that is for forecasting now if you’re curious what forecasting is just look up a chart we have our moving averages that we’ve been working on but we also spend dots off to the side and those dots are actually forecasted values for where the moving average is gonna be and we’ve done a lot of work in this particular script from the last one so there’s a lot to cover some of it is you know intermediate level programming stuff that isn’t gonna be super easy but I’m covering the source code for you and the source code is completely open on trading views so even if you don’t fully understand it you’ll have access to it and can play around with it to manipulate it however you want so let’s go ahead and get started there’s a couple of small things I wanted to cover really quick before we get into the meat of the video and that is we have added some minimum values to our moving average periods and we’ve also added a step size now what the step is is just the increment between points in the setting and for example the MA one when we tick this up it goes up by one and that’s the step size and it also goes down by one every time you take it now for example if you set the step size to something else let’s say 0.25 in this setting down here you can see that it goes down by 0.25 and it goes up by 0.25 that’s what the step size is that’s really all it takes care of now there was one other thing and that is the plots for our moving averages we forgot to give them a title so I’ve given them a title and now when you go to edit you can see that our plots actually have a title for MA 1 ma 2 and MA 3 so when you edit these styles for the moving averages you’ll know which one you’re editing it for now let’s get on to forecasting now what is forecasting it’s pretty difficult concept for some people but honestly it’s not that difficult all we’re doing is just removing the oldest candles out of a moving average calculation and replacing them with a new candle of the current price now there are ways we can change that but for now we’re gonna cover some basic forecasting which is let’s say we wanted to go 20 candles back and this is the 20th candle and we want to forecast one candle ahead so what we have to do is we have to remove this candle from our calculation and then we have to work with the 19 candles get the moving average of those 19 candles and then we have to get the price now and then we have to wait this moving average from those 19 candles 19 times and then we have our individually weighted current price as a new candle as the future forecasted candle and then we get our moving average with the weighted value of moving average I know this is starting to sound a little complex we have our 19 candle average from where we remove the oldest candle and we have the current price and we wait those two together in a simple moving average of just two items in this case and we get our forecasted value now when you’re forecasting two or three candles ahead you’re moving the two oldest candles or the three oldest or however many candles you’re forecasting ahead you take those off of the back of your look-back period and then you just wait the current price in that many times so if you removed two candles you would wait in the current price twice versus the eighteen candle moving average yes I know it’s very confusing and I know I’ve said it’s confusing it’s not a simple topic for a lot of people but if you’re following along this far you probably have a pretty good idea of what I’m saying so I hope you understand now how are we going to make this work with our old version of code because what we were doing was we would calculate the moving averages based on an if and an if statement what type of moving average were we using and then it would spit out and a sign that that particular moving average a value well what we had to do is we had to create a function to where we can pass in the data that we wanted and it would spit out the moving average value based on that variable data now if you’re a programmer and you’re probably familiar with functions and that’s what we’re doing we’re replacing those if statements that we repeated several times with the function now the function in this case I called it ma and what it does is it does that one if statement but it uses that variable data to spit out one value that way we can assign those moving averages to the result of this function now this works similar to our if statements whatever the last line was that resulted in a value in your function will be the value of the moving average so if you wanted to assign ma one to a to a particular call of this function you would say ma 1 equals and then you would plug in your ma information in this function it would be ma 1 equals ma parentheses ma 1 type comma ma one source comment ma one period close parenthesis and that’s all you would have to do now the reason we had to do this and we’ve already discussed these calculations the reason we had to do this was because of the forecasting now it’s also cleaner code too but for the forecasting we had to change the period fairly often because we were removing the oldest candles from these calculations this is how we did that we use the period and we subtracted the forecasted amount ahead now ideally this would be done with the for loop and we wouldn’t have to do this over and over and we would only have and maybe four or five lines of code total as opposed to ten now that’s just a limitation with pine script is that it wouldn’t let me plot within the loop I think that’s probably just protection on there in or something to keep you from plotting too much on a single chart if you had an error in your logic now what I would have done in another language is I would have made a for loop with a variable starting at one and I would have incremented it up and done this calculation but replace the number one or whatever the number was here our forecast set amount ahead with that variable so if you’re more familiar with programming that’s probably a better way to do it and if they change pine script in the future to allow those sort of actions then I’ll go back and I’ll change it or maybe you know and you’ve you’re aware of a way to do that now let me know and I’ll change it now I’d appreciate that but what we’re doing is we’re setting our forecasted value here to that nineteen period look back when we’re talking about a 20-period moving average if they may one was twenty period now we’re subtracting one from it and that essentially removes the last candle the oldest candle from that moving average then we have to wait this one moving average value with that with that period minus our forecast value that weights it and then we have to add in our current price or our current source I should say and multiply that by the weight of our forecast so if we’re looking two candles ahead here the the value would be the price times two now here it’s actually taking this and it’s multiplying it by what 19 if we’re doing a 19 period look back so it gets the moving average multiplies it by 19 some really big number and then we add on that 1 into it so now we essentially have the sum or cumulative value of what our period would be and we could divide that by the number in our period and we can calculate what our forecasted value is now this works pretty well let’s look at the chart this is a weekly chart on Bitcoin and you can see that it forecasts the price to continue moving up if price stays the same on the 50 week but you can see the 100 week is actually trending down even if the price were to stay flat here now before I get too far ahead you can already see that it looks like it might predict an intersection in the future which might be a signal that you should buy or sell depending on what the market says but let’s go ahead and look at these functions real quick I have this documented in the code this is just some documentation that shows you how the functions work how multi-line functions work etc there’s plenty of information here you can actually plot a value that cat that is calculated from a function in the plot line so there’s plenty you can do I definitely recommend you check out the documentation if you’re going to work with it for yourself with something else but for what we’ve done here there’s probably plenty for your moving averages you can figure out now that was actually quite a lot and you can see this is the MA one forecast here and I had to repeat that code or the MA – and the MA 3 now like I said ideally we would have loops that would take care of this for us but it’s ok we can repeat this code over and over it would have been very simple there’s not a whole lot of extra code this way since we only have 5 forecasted values if we had 20 then the three or four lines of code that a loop would have used would have saves a lot but since we only have four or five it’s not a huge deal right now honestly now what is a bias and with the indicator that I’m working at what we’re going to be talking about is a bullish bearish or neutral bias and neutral is the probably the most common way to do a forecast or most people when they’re thinking about it is you just take the current price and you move it out now other ways I’ve seen to do it is to use the slope of the moving average and kind of print that on out further and use the calculated value based on the slope of the moving average in the future as that value to see where the moving average would be I’m not really sure why that would be a better way than any other way so what I’ve done is I’ve actually created a way to where you can manage the bias in a bullish or a bearish factor so that you can see the potential impacts on the forecasting so let’s pull this up and I’ll show you let’s go back to our inputs and we have bias here this is a neutral bias right now so this is as if the price were to stay flat for the next five candles you see the forecast goes slightly down here slightly up here let’s try changing it to a bullish bias ah you can see they both kind of moved up the 100 still kind of moves down let’s say it might even go up first and then move down and then the 50 just kind of continues to move up a little bit more rapid pace now what’s happening is instead of using the price for the next five candles or calculating the slope of this line and pushing it out five candles and calculating where it would be what we’re doing is we’re actually getting the average true range there’s kind of a measure of volatility for the candles in the past we’re getting the average true range of the 14 period look back and we’re applying that forecast in a bullish or bearish way to calculate where the price would go because honestly if you look back at bitcoins history or pretty much anything the price doesn’t Stace stay flat for very long there’s usually some sort of volatility and if there is volatility it’s usually bull barish now it’s not always bullish and it’s not always bearish so to handle that I done something called what I call a magnitude and essentially with a magnitude of one it takes the average true range of the last 14 candles and predicts the price to move up each candle by that average true range amount now if it were bearish it would move down by that average true range amount by one if the magnitude was one now essentially all the magnitude does is it multiplies this average true range by a certain number so that you can manipulate how big of an effect you think is gonna happen so for example while price was consolidating here and you knew there was gonna be a big breakout and you thought it was gonna be bearish you could have set your bias to bearish and change your magnitude much higher and you can see the effect this is having on the forecast the higher the magnitude the more it’s pushing it down so if you think the price is gonna go down like quite substantially then you can see the effect this would have on the moving averages now I wouldn’t recommend a number that high most likely but it might be a good idea to use point 5 here because essentially this is a bullish direction and it’s a good way to account for some of the candles being read because if you just multiply it by one you’re you’re essentially saying the average true range 14 times in a row and that’s not really realistic if you were to do that candle by candle but it is a way for you to be able to manipulate it now how do we do this I’ve already kind of mentioned an average true range and multiplying that and really that’s all it is let’s go through and look at how we calculate the bias now the bias is used for all of the different forecasts because it is predicting essentially the next candle where that price is going to be from where we were now how do we do that we made a function for bias to calculate the bias now if your your forecast bias is neutral it returns zero okay we’re not going to add anything additional to the candle so what’s happening is it’s actually using the base price here and it’s adding on top of that the average true range but since we’re neutral here we’re not adding anything on top of it now if it were bullish as I mentioned it would use the average true range of the bias period which is 14 by default it’s just a pretty standard average true range and then you multiply that value magnitude so your next candle predicted out the price would be based on the average true range on top of the current price okay so it would add that average true range up and this is what it would expect for the next price and it would continue doing that for each candle now if you were to do a bearish bias you’ll see that it does the exact same thing as the bullish except it multiplies it by negative one so it’ll take your current price and it will add a negative number which just subtracts it to where it’ll think your forecasted price is gonna be based on this value on this candle which is lower so hopefully this all makes sense and what we do in order to accommodate that for each length of the forecast is we just add that on there as many times as we’re forecasting out this calculation works pretty well so you can find this script on my profile and this is the sixth one and by the time you look at this there’s probably gonna be more i’ve already started working on a seventh which has some new stuff and it will talk about in the next video but you can get this and you can look at the source for yourself and play around with it but more importantly if you’re interested in seeing where something might crossover based on these changes you can play around with the settings yourself change the magnitude change the the bias period for the ATR change whether it’s bullish bearish or neutral you know there’s plenty of things you can do to impact the forecasting here to get it to work to how you think the market is gonna move like I said if you think it’s gonna be bearish set it to bearish if you think is gonna be really bearish change the magnitude to a higher number and you can see the impacts all this is gonna have on it I think it’s pretty cool I haven’t seen this on an indicator before and I guarantee you in the next video we’re gonna be doing something really neat and that is changing the resolution for each of these moving averages so you could be looking at a weekly chart or let’s say for example we’re looking at the daily chart we could we can plot the weekly moving average on the daily chart so that you can see where a weekly moving average such as the 200 here which proves support back here you can see this on a daily chart and maybe that’s helpful for spotting support or resistance when you’re looking in at much lower timeframes much lower resolution thank you for watching that is the video for today please hit like if you liked the video I know there was a lot to cover and there’s a lot more going on and please subscribe if you like this series we’re doing all kinds of videos about trading and automation indicators things like that we’re doing all kinds of stuff and if you got any ideas please let me know I love to look into doing the ideas that people submit we’re gonna be working on a lot of projects related to cryptocurrency and such on this channel so please please subscribe that’s all for today and I look forward to you watching the next [Music]
YouTube Video Description
< br/> ???? IMPORTANT LINKS BELOW ????
Forecast Values: In this TradingView Pine Script Tutorial we discuss how to forecast future values with our indicators in Pine. We can forecast values through a method of shifting our indicator right, and replacing future data with the current value, or with a biased set of data to find a potential forecasted value for our indicators in TradingView. With Pine Script it is very easy for even beginners to create their own indicators that have many other indicators within them. Once we have completed the script, we can see our results immediately and begin working with more functions and indicators before eventually moving on to creating our own strategies.
??♂️??♂️??♂️??♂️??♂️??♂️??♂️??♂️??♂️??♂️
Social and other public profiles
??♂️??♂️??♂️??♂️??♂️??♂️??♂️??♂️??♂️??♂️
? Website: https://bigbits.io
? Discord: https://discord.gg/rapMn4z
? Twitter: https://twitter.com/BigBitsIO
? Facebook: https://www.facebook.com/BigBitsIO/
??GitHub: https://github.com/BigBitsIO
?TradingView: https://www.tradingview.com/u/BigBitsIO
???????????
Referral links
???????????
? Buy, Sell and Trade Crypto on Binance.US with LOW fees: https://www.binance.us/?ref=35105151
?♂️ Want to buy crypto? Get $10 of bitcoin w/ your first purchase over $100: https://www.coinbase.com/join/johnso_dxz
? Sign up for a paid plan at TradingView and receive a $30 credit: https://www.tradingview.com/gopro/?share_your_love=BigBitsIO
? Browse privately and get rewarded with Brave Browser: https://brave.com/big406
? Receive bonus perks when purchasing Lightnite Game: https://lightnite.io/ref=BigBits
VIEW ALL HERE: https://bigbits.io/bigbits-referrals/
❗️❗️❗️❗️❗️❗️❗️❗️❗️❗️❗️❗️❗️❗️❗️❗️❗️❗️❗️❗️❗️❗️❗️❗️❗️❗️❗️❗️❗️❗️❗️❗️❗️
DISCLAIMER: All my videos are for educational and entertainment purposes only. Nothing in this or any of my videos should be interpreted as financial advice or a recommendation to buy or sell any sort of security or investment including all types of crypto coins and tokens. Consult with a professional financial advisor before making any financial decisions. Investing in general and particularly with crypto trading especially is risky and has the potential for one to lose most or all of the initial investment. In simple terms, you are responsible for your actions when trading.
❗️❗️❗️❗️❗️❗️❗️❗️❗️❗️❗️❗️❗️❗️❗️❗️❗️❗️❗️❗️❗️❗️❗️❗️❗️❗️❗️❗️❗️❗️❗️❗️❗️
#bitcoin #crypto #cryptocurrencies #tradingview #binance #binanceUS #coinbase
This channel focuses on Bitcoin, Ethereum, LiteCoin, Ripple, Link, Basic Attention Token and almost all cryptocurrencies that demand attention. Please like the video if you liked the video, and subscribe if you like these types of videos. David from BigBits is an experienced Software Engineer, but no one is perfect, If you find any issues with any of the open-source, free code, or code shown in videos please comment to let us know what to fix, we listen to our viewers!