YouTube Video
YouTube Video Transcript
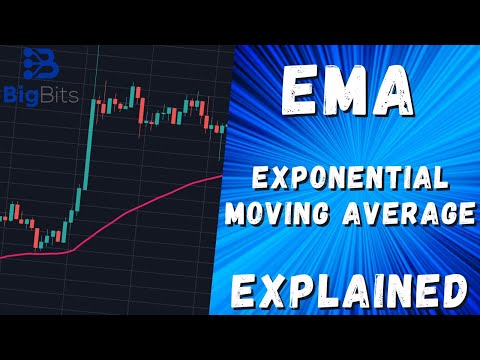
[Music] hey this is David for big bits and welcome to this video on understanding the exponential moving average now the exponential moving average is very similar to a simple moving average except it moves much quicker so for example when price kind of changes direction for example when going down to moving back up here it’s moving average moves a little bit quicker because the candles or the price at the most recent time is weighted more heavily than the price in the back whereas with a simple moving average all of the prices in the look-back period are all weighted exactly the same now we’ll get into the calculation in just a moment but I do want to show you how this line does differ from the simple moving average of the same time frame or the same look-back period so this EMA example that we’re using the blue line is using a 12 period EMA which means it’s looking back 12 periods to calculate its current exponential moving average and you can see the blue line its values then we’re gonna the same thing but I’m gonna show you now a 12 period simple moving average okay so you can see here when the price started to go down the blue line moved down quicker that’s because with the exponential moving average the values are weighted more heavily on the most recent candles now similarly when the price started to go back up the EMA also moved quicker back up then the simple moving average and it continued to do so and by now I think you kind of get the point the exponential moving average just moves quicker than the simple moving average as far as doing an exponential moving average on tradingview it’s very simple it has a built in function you can just call the EMA using the closing price of the candle and the periods back and you just plot that on the screen that’s our blue line now I’m gonna hide this I’m gonna actually show you a couple of different EMAS we have the 12th period SMA we’re gonna actually use a 12th period EMA on the green line and then we’re also going to be showing you the 26 period EMA which these are pretty common exponential moving averages to use and we’ll go over a little bit of that in just a moment now I showed you how tradingview uses its built-in function when you plot it on the screen for the exponential moving average but it does actually use a more complicated mathematical formula than the simple moving average of course because we have to wait the most recent candles more heavily and we’ll get into that in just a moment I just wanted you to see the difference between the SMA and the EMA first on the chart and explain to you why that’s the case so let’s actually get into kind of some more information as we did in the last video with a simple moving average we’re going to go over the exponential moving average on investopedia and if we find other resources later in other videos we might use other sources so if you haven’t seen the simple moving average video then I suggest you go back and do that so you can kind of understand some of the concepts we’re doing here if you don’t kind of pick up on what’s going on so the exponential moving average and they say pretty much the same thing I’ve been telling you that it places a greater weight and thus a greater significance on the most recent data points so the same thing as we’ve been saying the most recent candles are weighted more heavily that’s all that is and they have some key takeaways the EMA is a moving average okay we already covered that more more weight more significance on the most recent data like all moving averages this technical indicator is used to produce buy and sell signals signals based on crossovers and divergences from the historical average and this is similar to the simple moving average but we didn’t also talk about divergences as much with a simple moving average now traders often use several different EMA days for since 20-day 30-day 90-day and 200-day moving averages with their exponential moving average now as far as calculating the exponential moving average this basically just tells us how they weighed it more heavily and you’ll notice that you actually have to calculate the simple moving average first and you’ll notice it doesn’t reference the simple moving average again in the calculation so I’ll explain to you why in just a moment you have to do this simple moving average first now you also have to do a multiplier which does the smoothing for the moving average and to do that you just take two and divide that by your look-back period plus one so if we’re doing a 12 period EMA this would be 2 divided by 13 and the final step in calculating your exponential moving average is to take the current closing price subtract the EMA from the previous period and you multiply that times the multiplier that we calculated in step 2 and then you also add in the exponential moving average from the previous period now you’re probably still wondering why the simple moving average wasn’t mentioned again even though it made you calculate it in the first part well the reason that is is because going back throughout all of the chart history and going back through all of the candles there is at one point no more history to go back you’re looking at the very first candle and in order to calculate your very first exponential moving average if you don’t have an exponential moving average for the previous day you’re supposed to use the simple moving average of the same period so for example if we are doing an exponential moving average for the period of 12 on the 12th candle we wouldn’t have an exponential moving average on the 11th candle because there wasn’t enough data however we are able to calculate a simple moving average because it doesn’t rely on the existence of its value in the past so essentially you’re seeding the EMA calculation with the simple moving average to our doubt with and this is only on the very first candle that it calculates the EMA where it doesn’t have an EMA value in the past so that might be a little bit confusing for the most part you’re never gonna have to worry about the calculation you mainly just need to remember that the most recent candles are weighted more heavily and that’s about all you need to know as far as the calculation in other indicators it’s important to understand the calculation a bit more because it can have impacts on how the price changes these tend to follow the price relatively closely well at least the trend in the price relatively closely so that you can get an idea of where things are going whereas with other indicators it might be harder to tell so it’s better to understand the math for them here you’re probably fine if you don’t really understand what’s going on but in case you wanted to know we went over it and if you have any questions please leave a comment in the comment section of the video and I’ll try to respond to you now what does this tell you a lot of people use the 12 and 26 day moving averages and those are actually pretty important and I’ll tell you why in just a moment they use these on intraday charts but more importantly they’re used to calculate other indicators and that’s why I’ve chosen to go over the simple moving average in our first video and the exponential moving average in our second video because a lot of other indicators use the simple moving average or the exponential moving average or other moving averages to calculate their own values so the simple moving average or just any moving average is very important to kind of understand how other indicators work as well and to prove that point the 12 and the 26 period exponential moving average are used to calculate the moving average Convergence divergence that are known as the MACD and the percentage price oscillator and then people also use this similarly to the simple moving average with 50 and 200 period EMA’s signaling longer-term trends we also have of course we’ve talked about the trends we also have some other things here they look at trading within the intraday markets so for example we’re looking at the chart here on 5 minutes and we’re using the exponential moving averages and comparing those here but if you look on the daily chart you can see that the exponential moving average is moving up so if you were still within this particular day and you were trading and you zoomed into the chart to look at the 5-minute candles if the exponential moving average of the entire day was still moving up you would use that to help yourself try to place Long’s or to go long and buy in this particular case when you get the signals throughout the day so that’s what they kind of mean by that you would use the longer-term trend within the shorter term trend to help you have a bias on which direction you think the price would go so if price is trending up throughout the last 50 days then it’s likely throughout today it’s a good idea to go long at least that’s what this is saying and of course that doesn’t always happen so please keep that in mind and that about covers it for the exponential moving average in the next videos we’re going to go over some more indicators we’re going to be talking about some more moving averages and hopefully we’ll also get into covering the MACD which consumes the exponential moving averages to calculate its own values and you can get an idea of how the exponential moving averages calculated within that will impact its values going forward so I hope you appreciate this video if you do please leave a like if you like these videos and you’d like to see more please hit subscribe if you have any questions or comments or would like to see any indicators of your own idea that you would like to see described or explained on this channel please also leave a comment on the comment section of the video but it also if you’re curious on any of the coding that we’re doing I showed you how we would plot that with code back here on the chart if you’re interested in any of this and making your own indicators I have a video series entirely dedicated to making your own indicators and you can find that on my channel as well otherwise you can check out my trading view profile and you can find a bunch of the indicators that I’ve created as well including the moving averages that we use to displace some of the information earlier but that’s all for this particular video I’d like to thank you and have a nice day [Music]
YouTube Video Description
< br/> ???? IMPORTANT LINKS BELOW ????
Explained: The EMA or Exponential Moving Average Indicator is a moving average that averages all of the prices/values in a particular period of time, but weights the most recent values exponentially. The is a very common trading indicator, and one of the most common types of moving averages used. Exponential weighting of values in this indicator helps reduce ‘lag’ in the moving average values compared to slower moving averages such as the simple moving average (SMA). Fortunately TradingView has a built-in EMA function so that you won’t have to calculate this yourself.
https://www.investopedia.com/terms/e/ema.asp
??♂️??♂️??♂️??♂️??♂️??♂️??♂️??♂️??♂️??♂️
Social and other public profiles
??♂️??♂️??♂️??♂️??♂️??♂️??♂️??♂️??♂️??♂️
? Website: https://bigbits.io
? Discord: https://discord.gg/rapMn4z
? Twitter: https://twitter.com/BigBitsIO
? Facebook: https://www.facebook.com/BigBitsIO/
??GitHub: https://github.com/BigBitsIO
?TradingView: https://www.tradingview.com/u/BigBitsIO
???????????
Referral links
???????????
? Buy, Sell and Trade Crypto on Binance.US with LOW fees: https://www.binance.us/?ref=35105151
?♂️ Want to buy crypto? Get $10 of bitcoin w/ your first purchase over $100: https://www.coinbase.com/join/johnso_dxz
? Sign up for a paid plan at TradingView and receive a $30 credit: https://www.tradingview.com/gopro/?share_your_love=BigBitsIO
? Browse privately and get rewarded with Brave Browser: https://brave.com/big406
? Receive bonus perks when purchasing Lightnite Game: https://lightnite.io/ref=BigBits
VIEW ALL HERE: https://bigbits.io/bigbits-referrals/
❗️❗️❗️❗️❗️❗️❗️❗️❗️❗️❗️❗️❗️❗️❗️❗️❗️❗️❗️❗️❗️❗️❗️❗️❗️❗️❗️❗️❗️❗️❗️❗️❗️
DISCLAIMER: All my videos are for educational and entertainment purposes only. Nothing in this or any of my videos should be interpreted as financial advice or a recommendation to buy or sell any sort of security or investment including all types of crypto coins and tokens. Consult with a professional financial advisor before making any financial decisions. Investing in general and particularly with crypto trading especially is risky and has the potential for one to lose most or all of the initial investment. In simple terms, you are responsible for your actions when trading.
❗️❗️❗️❗️❗️❗️❗️❗️❗️❗️❗️❗️❗️❗️❗️❗️❗️❗️❗️❗️❗️❗️❗️❗️❗️❗️❗️❗️❗️❗️❗️❗️❗️
#bitcoin #crypto #cryptocurrencies #tradingview #binance #binanceUS #coinbase
This channel focuses on Bitcoin, Ethereum, LiteCoin, Ripple, Link, Basic Attention Token and almost all cryptocurrencies that demand attention. Please like the video if you liked the video, and subscribe if you like these types of videos. David from BigBits is an experienced Software Engineer, but no one is perfect, If you find any issues with any of the open-source, free code, or code shown in videos please comment to let us know what to fix, we listen to our viewers!


